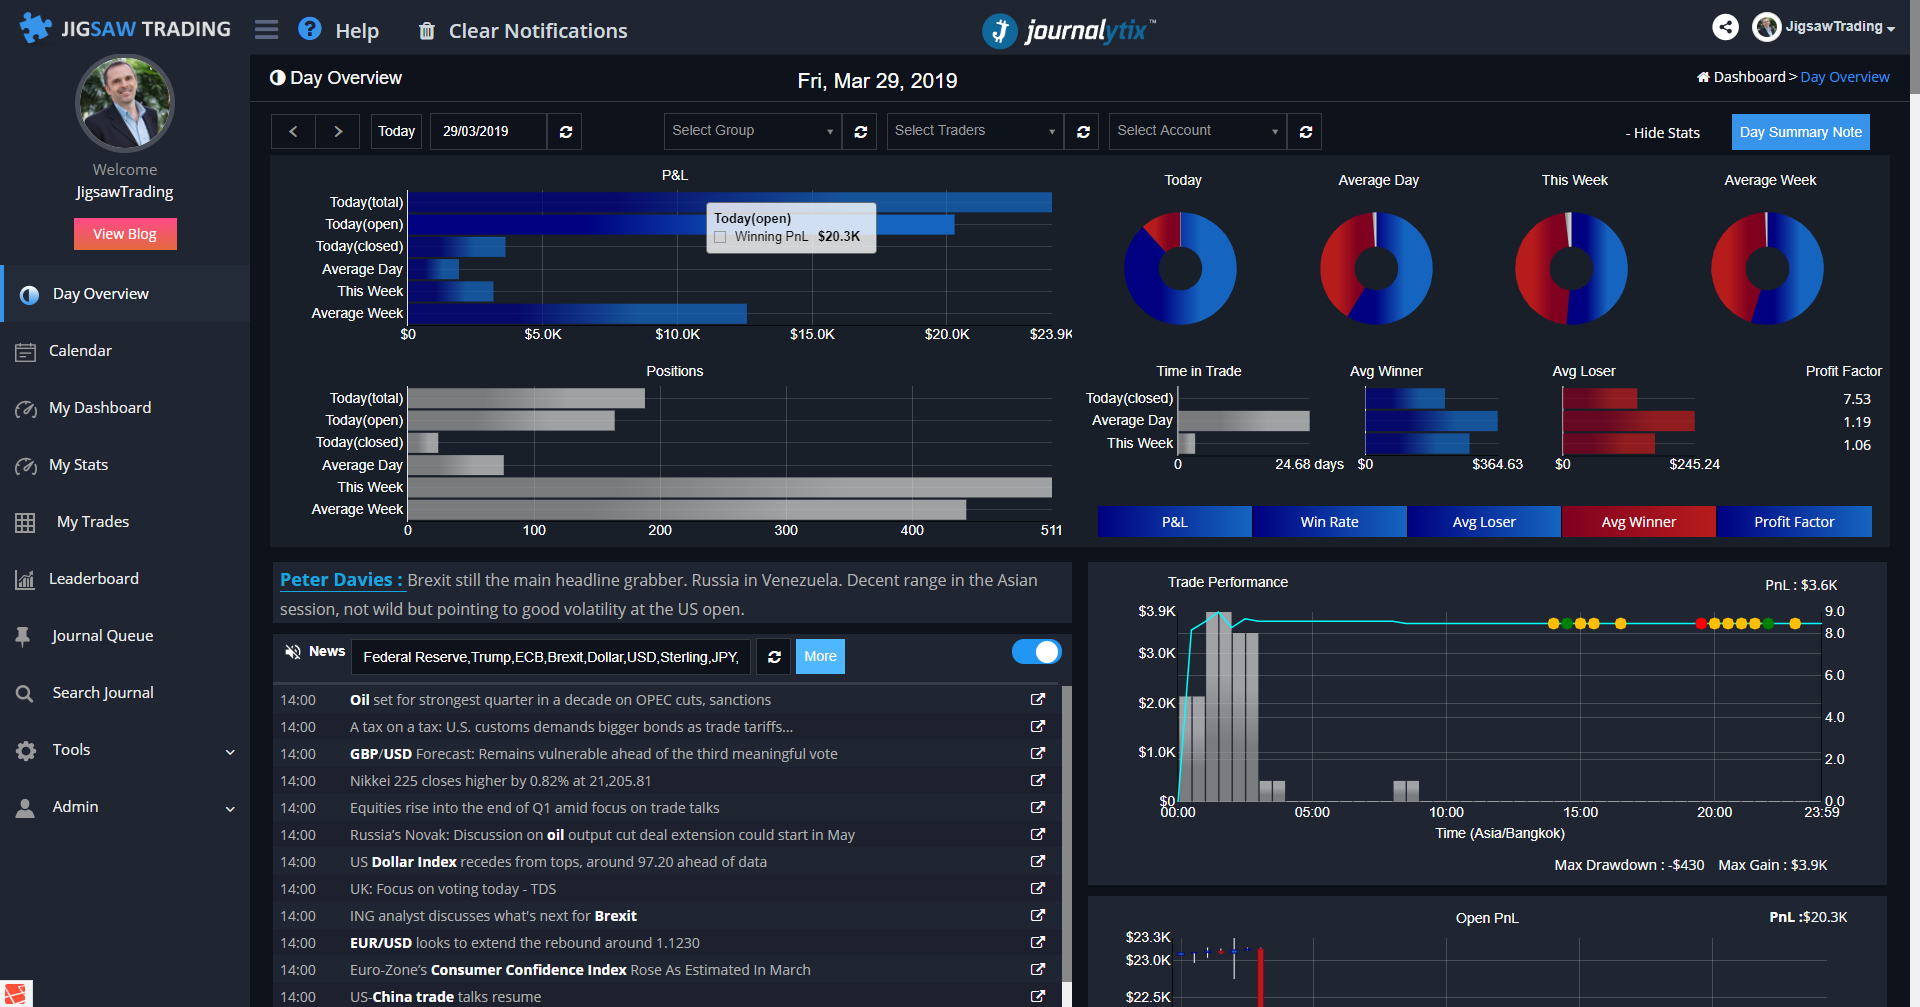
The Day Overview is your trading diary. It shows overall P&L, your daily notes, the economic releases for the day, performance chart, risk chart and a list of trades in closed order with running PnL. Note that individual trades are in exchange currency and running PnL is in local currency.
You can scroll backwards and forwards through days, you can select a specific date from a calendar and you can select accounts (and other options for trader group managers).
Selection
Here's how you can choose & filter the data you are looking at on the day overview.
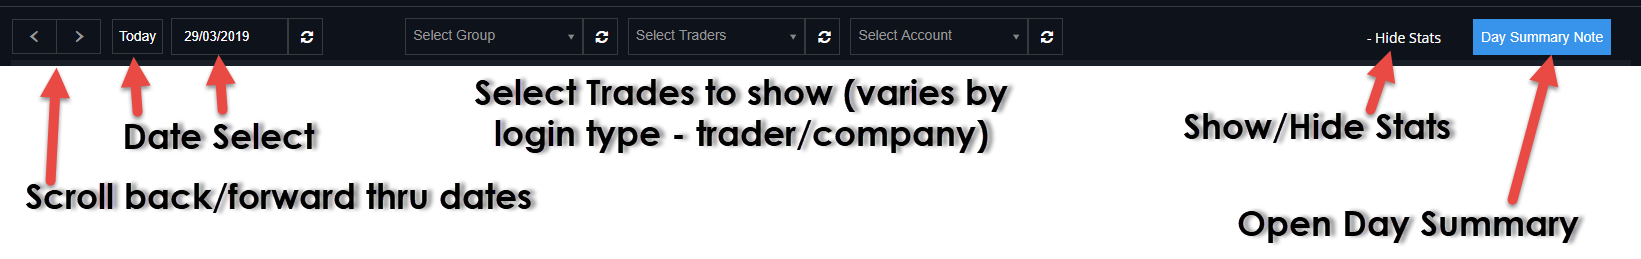
Statistics
The statistics section shows todays statistics compared to historical averages (8 weeks of history is considered). All charts are updated in real time as you open/close trades and as open P&L changes. All amounts include commissions. Averages are considered from days you closed positions, so non-traded days are not considered when calculating averages.
Floating the mouse over any chart will show you the actual numbers the chart was based on.
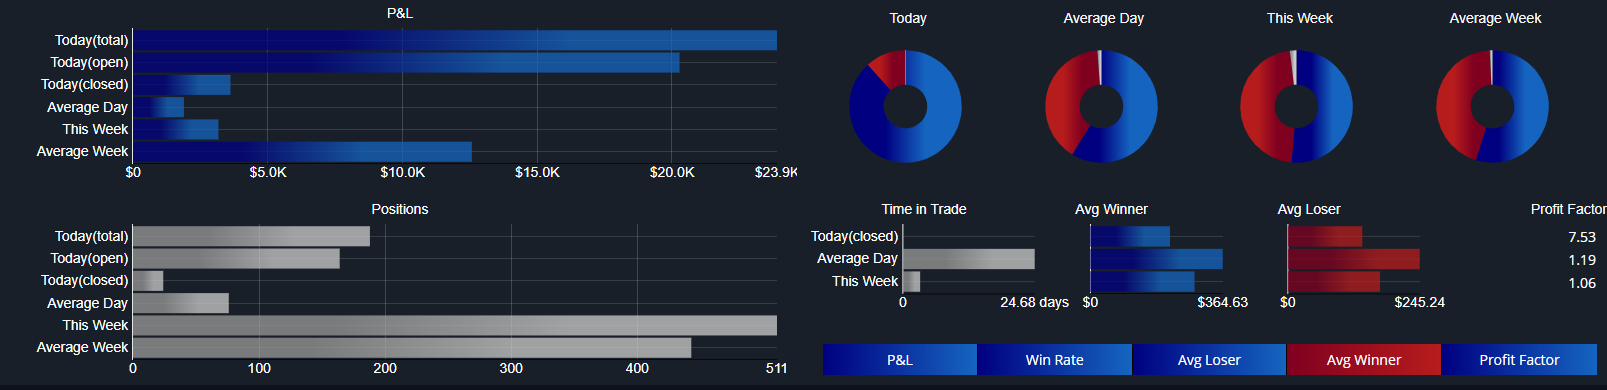
Top left - P&L section - shows today's total, open and closed P&L. We also show total P&L This week (closed only). We also show the Average Day and Average weeks P&L.
Bottom Left - Positions - shows a count of positions, so we can assess if we are trading more or less than historical averages.
Top Right - Donut Charts - shows relative P&L of winners & losers for. This gives us at a glance view to see how we are doing in terms of ratio between losses and wins. The blue section represents total win amount, the red section represents total loss amount and the silver section the commissions
Middle Right - Other. Time in trade represents holding times. Avg Winner represents average size of winning trades. Avg Loser represents average losing trade size. Profit Factor shows the profit factor (wins / losses)
Bottom right - At a glance 'performance bars"
oP&L - blue if today's P&L is above average, red if below average, silver if no trading yet today.
oWin Rate - blue if today's win rate is above average, red if below average, silver if no trading yet today.
oAvg Loser - blue if today's average loser is below average, red if above average, silver if no trading yet today.
oAvg Winner - blue if today's average winner is above average, red if below average, silver if no trading yet today.
oProfit Factor - blue if today's profit factor is below average, red if above average, silver if no trading yet today.
Day Notes
Shows the daily trade notes for the selected users for that date. Click to view/edit full notes.

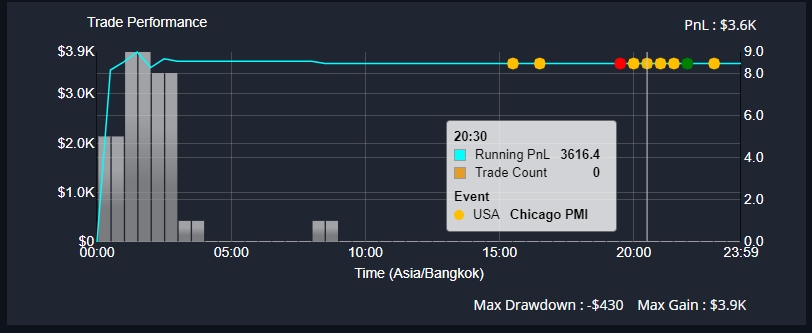
Trade Performance
Shows P&L over time. The cyan line shows P&L. The orange/green/red cirlces identify the highest ranking news item for that 30 minute period. The silver bars show number of positions closed in that 30 minute period.
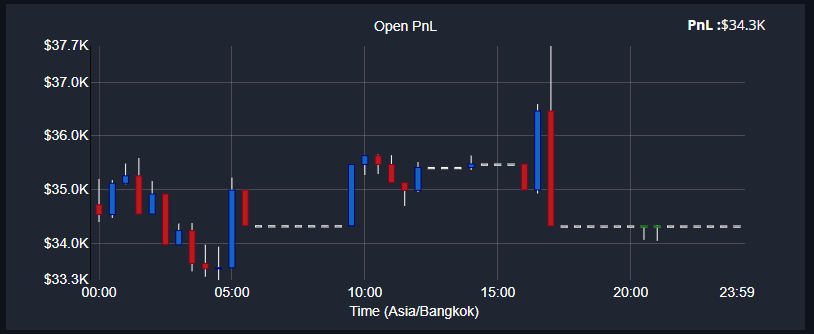
Open P&L
Shows the swings in open P&L through the day, very useful in identifying areas positions were held on to in hope they'd come back. Also very useful in identifying periods where we let trades run back against us.
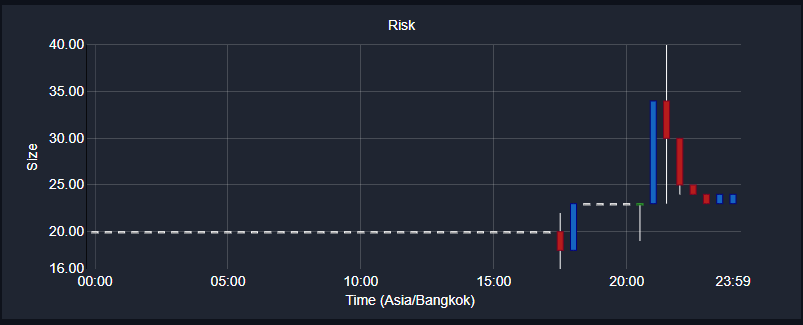
Risk
Shows number of open contracts exposure. Note that if one trader is long 20 contracts but another is short 7, then exposure will be 13 contracts.
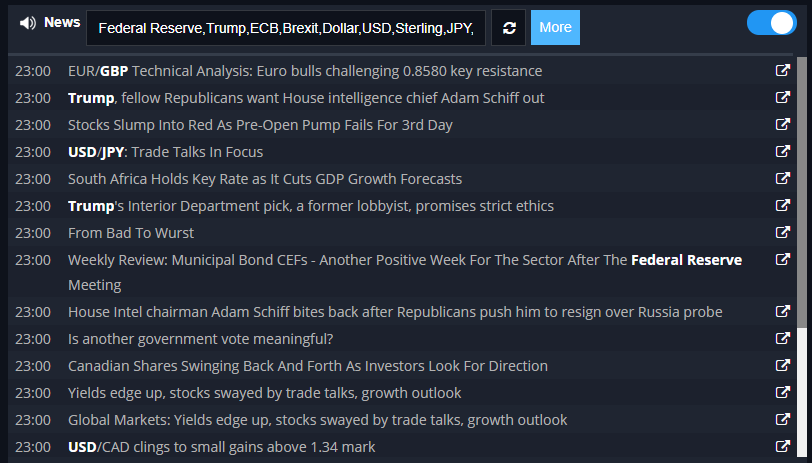
Real Time News
Shows real time news releases for the day from over 50 news outlets such as Bloomber, Reuters, Zacks etc. You can decide which countries news stories should appear on the Account Settings page.
See below for descriptions. See the News Filtering page for details on how to filter news so you see what's relevant to you.
Click the ![]() icon to enable/disable audio news reader. Check out the section on News Filtering.
icon to enable/disable audio news reader. Check out the section on News Filtering.
Click ![]() to get a description of the news release or to read the full news story.
to get a description of the news release or to read the full news story.
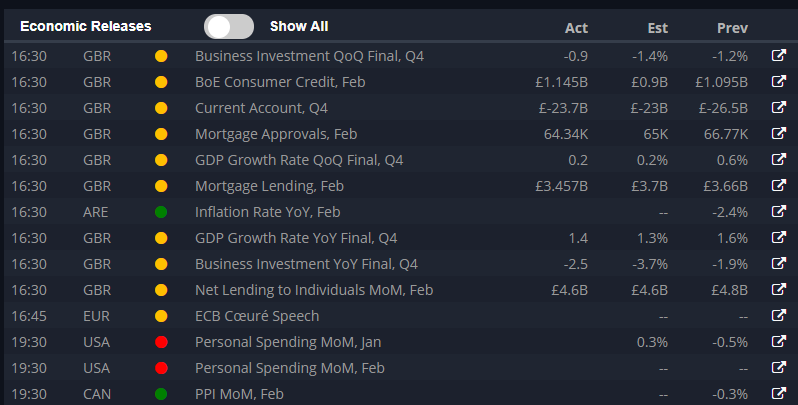
Economic Releases
shows the economic releases for the day in your timezone. You can decide which countries releases should appear in the list on the Account Settings page.
When you are looking at todays date, it'll show you the past 30 minutes releases plus the future releases for the day.
Use the ![]() button to show all events for the day. This is disable when looking at history. Note also you can scroll forwards to future dates to see future economic news schedules.
button to show all events for the day. This is disable when looking at history. Note also you can scroll forwards to future dates to see future economic news schedules.
Click ![]() to get a description of the news release or to read the economic news release details.
to get a description of the news release or to read the economic news release details.
Open & Closed Trades
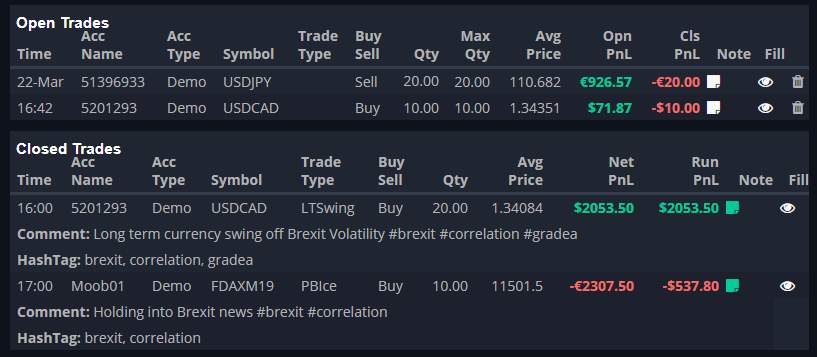
Open Trades - Shows a list of open trades, in the order they were closed, you can see the trade type, average price P&L for the trade, Running P&L. You can also see the first line of text from the journal as well as any hahstags in the journal entry.
Closed Trades - Shows a list of closed trades, in the order they were closed, you can see the trade type, average price P&L for the trade, Running P&L. You can also see the first line of text from the journal as well as any hahstags in the journal entry.