Profit Seeker is available to paid users only and is the most advanced trade analytics dashboard available anywhere. So what does this mean? Well, simply put, it helps you quickly analyze your trading to find patterns in the trading data that otherwise would remain hidden. It let's you drill down into the data extremely even when looking across many thousands of trades.
Data Selection
The first step is to select the data you want to look at. This will default to whatever data you were looking at last time you ran Profit Seeker

Date Range or All - you can enter a date range or click "All". If "All" is selected, then it will ignore the date range and show all closed positions.
Accounts - Select specific accounts or leave as default for all accounts.
Instrument - Select specific instruments or leave as default for all instruments.
Trade Type - Select specific trade types of leave as default for all trade types.
HashTag, All/Any - Select specific trade types of leave as default for all trade types. Note that if "All" is selected, then only positions with all of the selected tags are shown (tag combinations). If "Any" is selected, then positions with any hashtag are shown
Refresh - Reloads the data after changing the selection criteria.
![]() - Show "My Trades" view for current selected data
- Show "My Trades" view for current selected data
![]() - Show "Trade Notes" view for current selected data.
- Show "Trade Notes" view for current selected data.
In-Chart Filtering
You can click any chart on the dashboard to instantly update the filters so that all charts are now filtered by that data. The filters in place will appear at the top of the screen like this:

You can remove an indivdual filter by clicking the red "x" above and you can remove all filters using "Reset Filters"
Chart Buttons
Chart buttons are self explanatory
![]() - Allows us to export the chart, we don't advise exporting the data as it won't make much sense being summary data. You can export the charts as images, which is useful.
- Allows us to export the chart, we don't advise exporting the data as it won't make much sense being summary data. You can export the charts as images, which is useful.
![]() - Full screen mode. For charts with many data points, you can view in full screen mode so as to see the entire data at once.
- Full screen mode. For charts with many data points, you can view in full screen mode so as to see the entire data at once.
What If
The "what if" section allows us to study the impact of applying different rules to our trading data. For example "what if I stopped trading after I lost $1000 for the day or $3000 for the week?". How would a rule like that impact your trading?

Hide What If - hide/show the what if section. When hidden, a summary of the "what if" selection is shown in text.
Daily What Ifs
•Loss Limit - When this loss limit is reached, any positions placed after the position that breached the limit will be ignored. Results will be as if you stopped trading for the day when the limit was reached.
•Single Loss - When a trade that loses this amount or more is detected, any positions placed after the position that breached the limit will be ignored. Results will be as if you stopped trading for the day when the limit was reached.
•Max Losers - Sets a maximum number of losing trades for the day. Results will be as if you stopped trading for the day when the limit was reached.
•Consec Losers - Set the maximum number of consecutive losing trades for a day. Results will be as if you stopped trading for the day when the limit was reached.
Weekly What Ifs - similar to daily what ifs but looking across each week traded.
After entering or changing the what if's, click Apply and the data will be instantly refreshed. To remove the what if scenarios, click Clear and then Click Apply.
Running PnL & Period PnL
The Running PnL and Period PnL show you profit/loss. You can see years worth of data and within seconds zoom right down to the minute, then back up again. If you zoom in on one period, all other charts on the page will be instantly updated to reflect that period only.
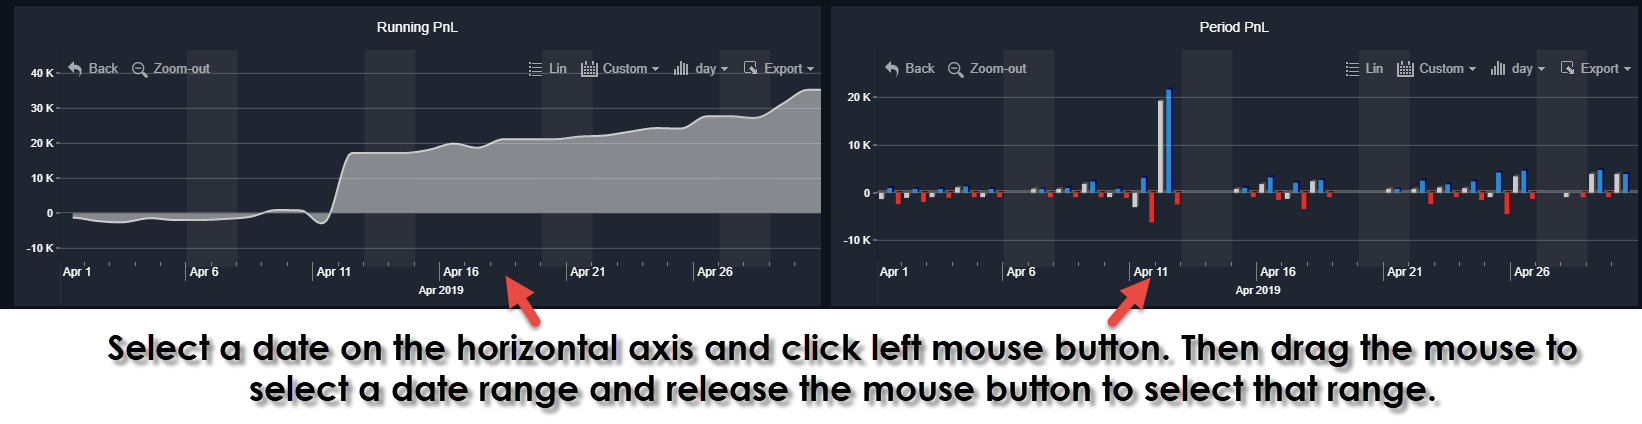
Running PnL - shows cumulative profit or loss over time
Period PnL - shows the PnL for each individual period. Grey for total PnL, Blue for Profits, Red for Losses
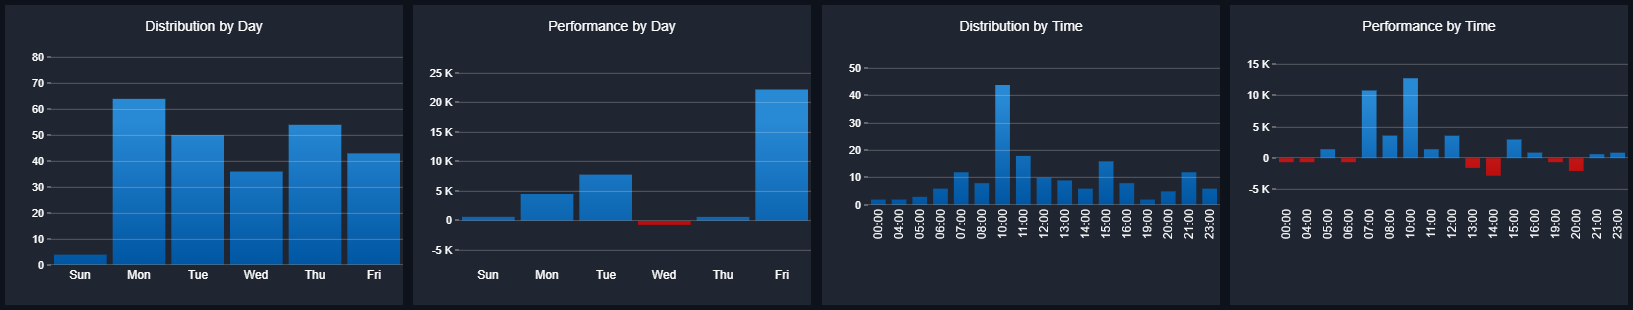
Day/Time Analysis
Shows distribution of trades/Profits by day and hour of day. Note that you can click on any of the bars to select that data set. If you want to click multiple bars hold down the ctrl key and select the bars you want. To unselect bars, simply click them again.
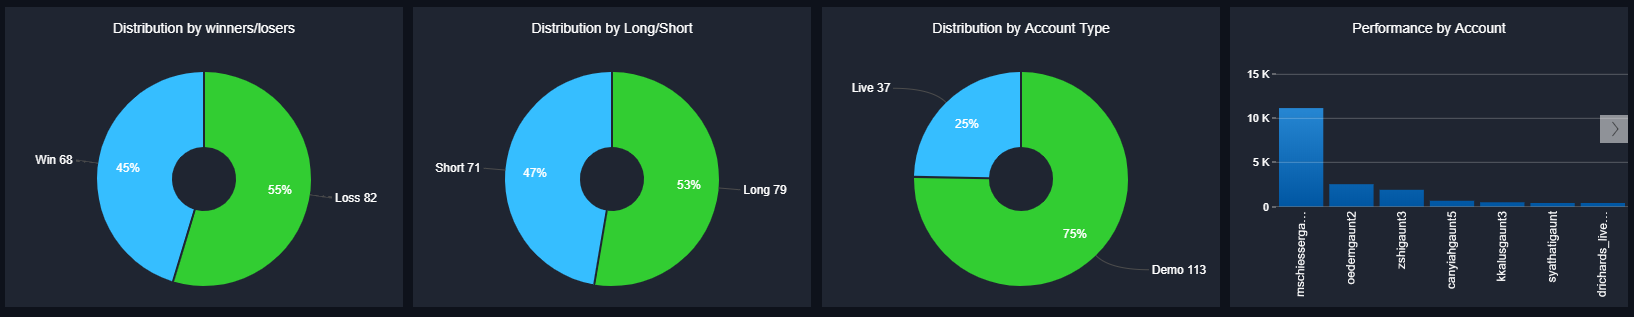
Distribution - Various
Shows distribution of trades by winner/losers, long/short and account type. The chart on the right gives us a breakdown by account number. Now that you can click on any section of a donut chart or bar chart to have all other charts. For example, I can click on short trades and then all of the other charts on the page will show data for short trades only (including "what if" analysis).
Market Analysis
Trade distribution, winning P&L, Losing P&L donut charts per market. Note that different expiries of the same futures contracts are not considered to be different market. Perofmance by market is also shown and you can show that in full screen mode to see all the data.
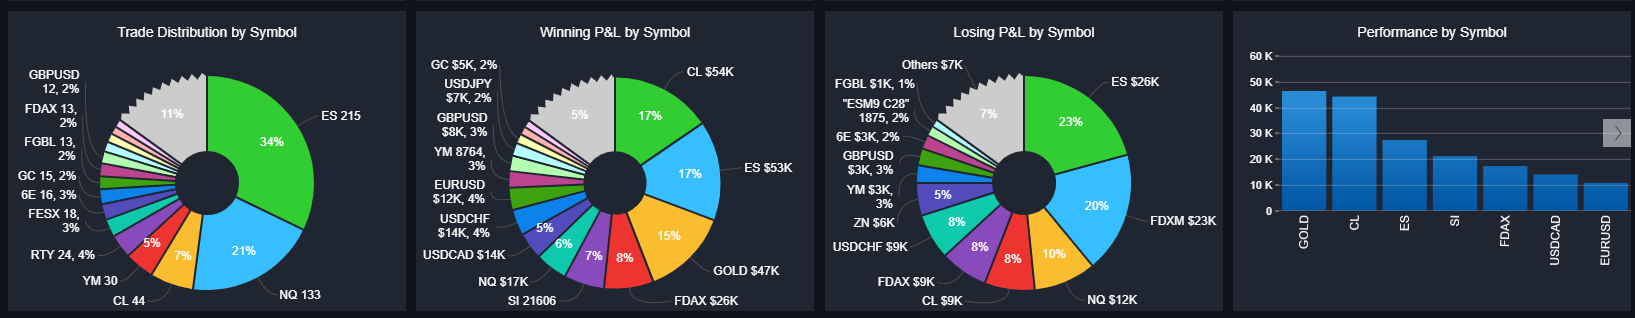
Once again, you can click any section of the donut chart or histogram to select that data. Holding down control while clicking allows you to select multiple data points.
In the above image - you can also see the "jagged" edge on one of the sections:
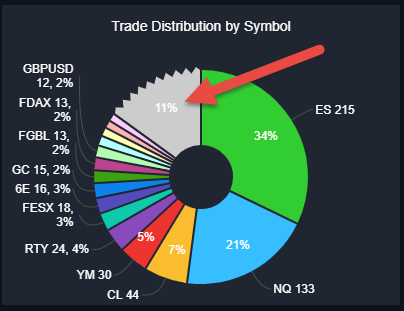
This means the section has more data 'behind it' - if you click the section, you will see more data:
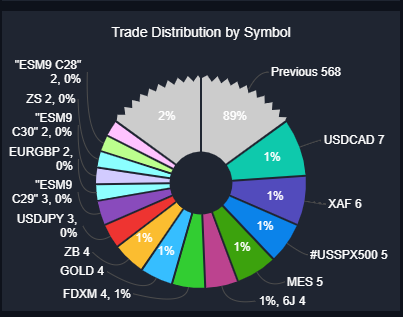
We now see 2 "jagged" sections - one to allow us to drill down further and the other to go back to the previous view, to drill back up.
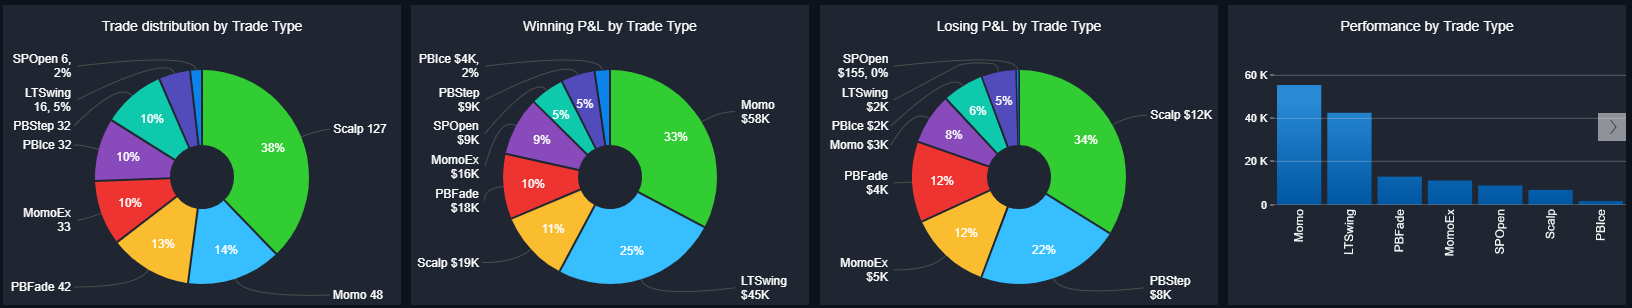
Trade Type Analysis
Trade type analysis gives similar analysis and functionality. It shows the different trade types used, shows trade distribution and P&L for each. Once again you can click on specific trade types on any chart and all other charts will be updated to select those trade types.
Hashtag Analysis
Trade type analysis gives similar analysis and functionality. It shows the different tags used, shows trade distribution and P&L for each. Once again you can click on specific tags on any chart and all other charts will be updated to select those tags. In this case, the P&L may be overstated if you add up profit from individual tags. One trade may have many tags, so that profit contributes to all tags included on that trade. This works well in practice.
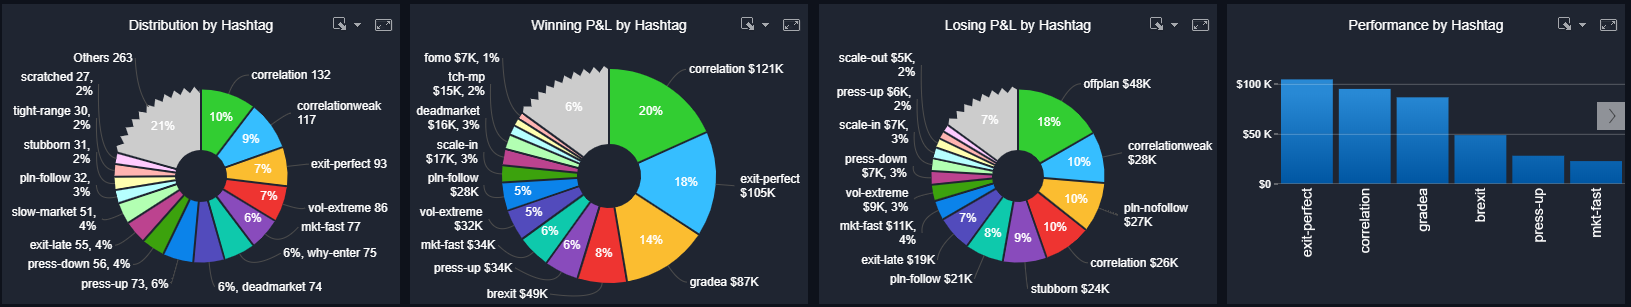
We also assess which pairs of hashtags are best and worse performing for the current selection:
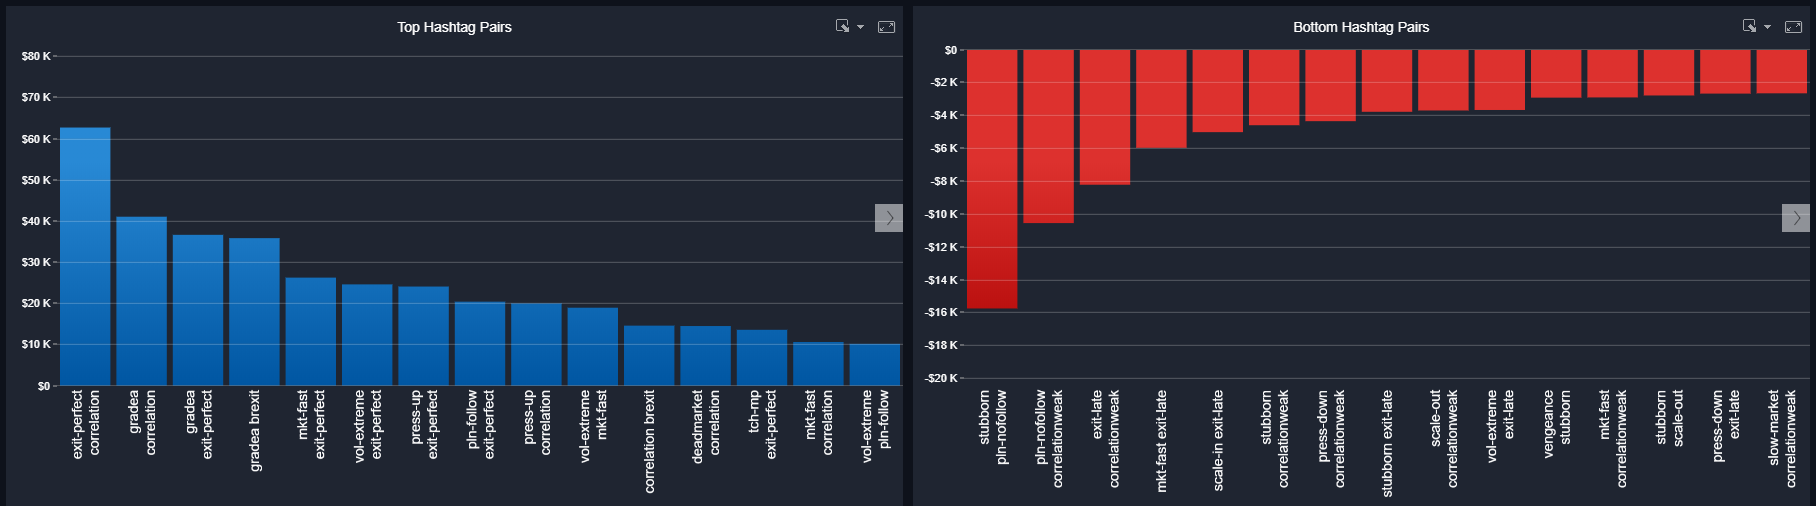
This is extremely powerful and will help you find more patterns in your behavior that you may have missed. As you can see - biggest losers above are "stubborn + Plan no follow" followed by "Plan no follow and weak correlation". The most profitable trades involve good correlation.